
Table of Contents
I have a few rental homes that I own and rent to tenants. When I first started renting them out, I was holding onto a book and I recorded every transaction, every expense, and every payment from these 2 homes. It wasn’t elegant and my handwriting wasn’t quite legible but I made do with what I had.
Since those days, I’ve grown away from those methods and started using computer spreadsheets to do my recording. Let me tell you, I don’t think I’m ever going to look back.
Let’s say for example you own your own rental home, and you needed to find a way to organize your entire income and expense reports from this home. I think you might be very interested in what Google Sheets has to offer in your case.
What can Google Sheets do for your business? Google Sheets is spreadsheet software that allows you to record and do work with data. This includes adding in numbers and creating rules that automatically calculate and crunch numbers for you. It can be a powerful tool to help you as a business owner to sort out the money coming in and the money coming out of your business.
While using Google Sheets, I was able to create a very well organized list of things I bought, fixed, and maintained in a rental home. I am also using Google Sheets to help me keep track of the rental payments and the amount due every month from my tenants.
Like I said before all this, I was writing everything regarding my finances into a notebook, a journal. Not to throw any shade against the good old fashion paper and pencil, which worked well for me in the beginning. As my expenses and income began to grow, so was my need to automate things. I wasn’t going to pay for an app that tried to figure out what I wanted. It was a waste of my money and I didn’t see any value in using its limited features.
There are a lot of reasons why I decided to move on to making my own form and using that for my finances.
But if you’re ready to plunge into the world of spreadsheets to record your financials, let me give you a brief tutorial on how I make mine work for me.
Keep in mind that this method is not limited or restricted to rental properties. If you need to keep track of something, and you want a free, customizable, and extremely powerful way to do it, then Google Sheets is the right way to go.
I’m going to show you how I organize my finances beyond the level of simply separating expenses and income. I’ve found a way to categorize my transactions and make Google Sheets give me data on exactly what it is I spend money on and what exactly it is I get money from.
How does keeping your books well organized using Google Sheets help with your business? Doing this really helps out your tax agent. Because as a landlord, you’re required to explain your spendings and earnings. You’ll need to put certain transactions into certain categories and give a sum or total of how much you’ve spent or made in that year alone.
I’m going to break this into two different parts. The first part is creating your list and setting a category to it. And then the second part will be how to sort it out and focus on one particular category or more.
Part 1: How to create a drop-down list for categories in Google Sheets
- Open up Google Sheets.
- Select and highlight a cell or group of cells in a column.
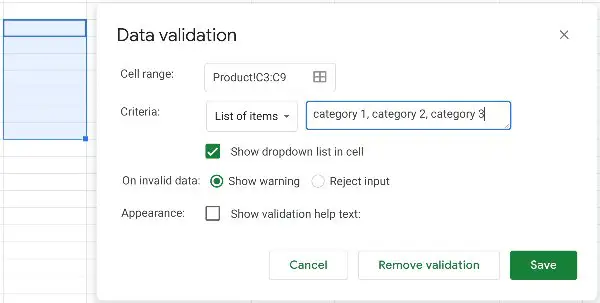
- Go to Data > Data Validation.
- Go to the Criteria drop-down list and select List of items.

- Type in your list of categories to the right of that drop-list separated by commas.
- Hit Save
You will now see these upside-down triangles on one side of every cell you highlighted in step 2. By clicking on the symbol, you’ll notice that it drops down with a list of your categories.
What I recommend is you should create a spreadsheet specifically for expenses and another one specifically for income. In the next part, let’s just focus on expenses. After we’re done, you simply just need to repeat these exact same steps for the income side to complete your spreadsheet.
Part 2: How to filter your categories
- Highlight the same column of cells as in step 2.
- Go to Data > Create a filter (take notice that the very top cell has a new icon that looks like an upside-down triangle made of horizontal lines)
- Click on this new icon.
- At the bottom, check and uncheck what you want and don’t want to see, respectively.
- Your list should now shorten with just the Category types you specified
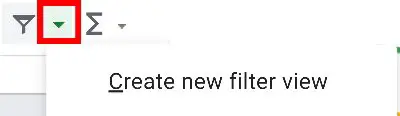
- Now go to the filter icon that looks like a funnel located in the top edit bar
- Click on the triangle icon next to it for further options
- Click on Save as filter view
- Rename the name for this filtered view
- Once done, click on the ‘X’ to close
This is recommended when you have lots and lots of data. It’s good because filtering helps you focus on what matters. Once you’ve created filters for all of your different categories, you can switch between the different filters and get a good focused view of all your spending in that particular category.
You’re not done yet! You need to know this
You need to turn off filters when you close the sheet
So one problem I’ve had was leaving the spreadsheet and coming back to it another day only to find that most of my data and categories were missing. It took me a few minutes to research what was going on and what I had done to perhaps lose all my data. What I found was a bit surprising. My data wasn’t gone, I just never turned off the filter mode.
So this is what happened.
Let’s say you leave Google Sheets right after creating a filter option. And this filter option currently only displays a particular category. It doesn’t matter what category as long as it’s filtered. When you’re all set and one with the spreadsheet you end up closing the program while it is in filtering mode. This is where you need to be considerate of what to do before closing the program because the next time you or someone who you share the file with opens up this Sheet, they will still see only that filtered data.
This might leave people confused with the only thought in their minds, “Where are all the data? Did we lose some of it?”
It’s a lesson learned so make sure you turn off filters or at least educate your collaborators on this situation.
In order to see everything again, simply turn off filter mode and it will once again show you everything. In order to do this, take a look at the funnel tab above and click on it to make sure it’s not highlighted.
How do I create more than 1 filter with different categories in Google Sheets?
Let’s say you want to focus on more than just one group but multiple groups of filters in your sheet. You want to easily switch between them because you need to create filters of different combinations of categories to learn more about your business.
I have a simple solution for you.
The way to do that is to click on the upside-down triangle next to the funnel/filter tab. Make sure you at least have one of the cells from your data table highlighted. If you don’t, Google Sheets will think you’re trying to create a filter for a different table. Google Sheets is able to recognize tables so all you need to do is highlight one of the cells in that table.
- Activate the funnel tab.
- In your column spreadsheet, click on the horizontal lines that form an upside-down triangle.
- Check and uncheck a new set of categories you wish to filter.
- Press Ok.
- Click on the triangle icon next to the funnel/filter tab in the editing icons above the spreadsheet.
- Click on Save as filter view.
- Create a new name for it.
You can create multiple versions of what you want to filter out and this is how you do it. This will allow you to conveniently see the list of filtered groups you’ve created. If you want to swap between your list of filters, simply go back to the triangle next to the funnel and you’ll see all the filters you’ve created.
How does creating filters on Google Sheets benefit a landlord?
I’ve created a spreadsheet for my two rental homes. These spreadsheets are split into two files and two different tabs within each file. Each file is an individual home. Each tab is either labeled as income or expense.
Within each of these tabs, whether it be income or expense, has a set of categories like repair, taxes, or something related.
See what happens here is that sometimes I’d like to find out how much I spend on certain categories like repair or maintenance, so this method of filtering out and focusing on certain categories or groups of categories really gives me a great deal of insight into my expenses and income.
I’ve been doing it for years and it’s been great to know how much I’m spending on certain things. And this really helps me a plan on my cash and savings for the future of those properties.